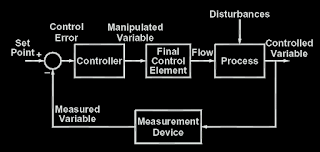
A change in either the flow through the control valve or one of the process disturbances leads to a change in the controlled variable.
The change in controlled variable is sensed by the measurement device, which changes the measured variable.
The control error is the difference between the set point and the measured variable. Therefore, a change in either the set point or the measured variable leads to a change in the control error.
The controller responds to a change in the control error by changing the manipulated variable (or valve position).
A change in the valve position leads to a change in the fl ow through the control valve, which is one of the inputs to the process.
Sunday, January 1, 2023
Block diagram of a control loop
The Control Loop. The information flow in the block diagram in Figure below takes the form of a loop:
As the measured variable is "feed back" to be compared with the set point, the term "feedback control" is commonly applied to such loops.
Subscribe to:
Posts (Atom)
